Design the future.

How I can help? Multiple selection

Web App
App
E-Commerce
Website
Branding
Other

What is your budget?

Up to 20K
20K - 50K
50K - 100K
Over 100K

How did you found me? Multiple selection

Social Media
Google
Colleagues
Friends
Other

Tell us more about you and your project

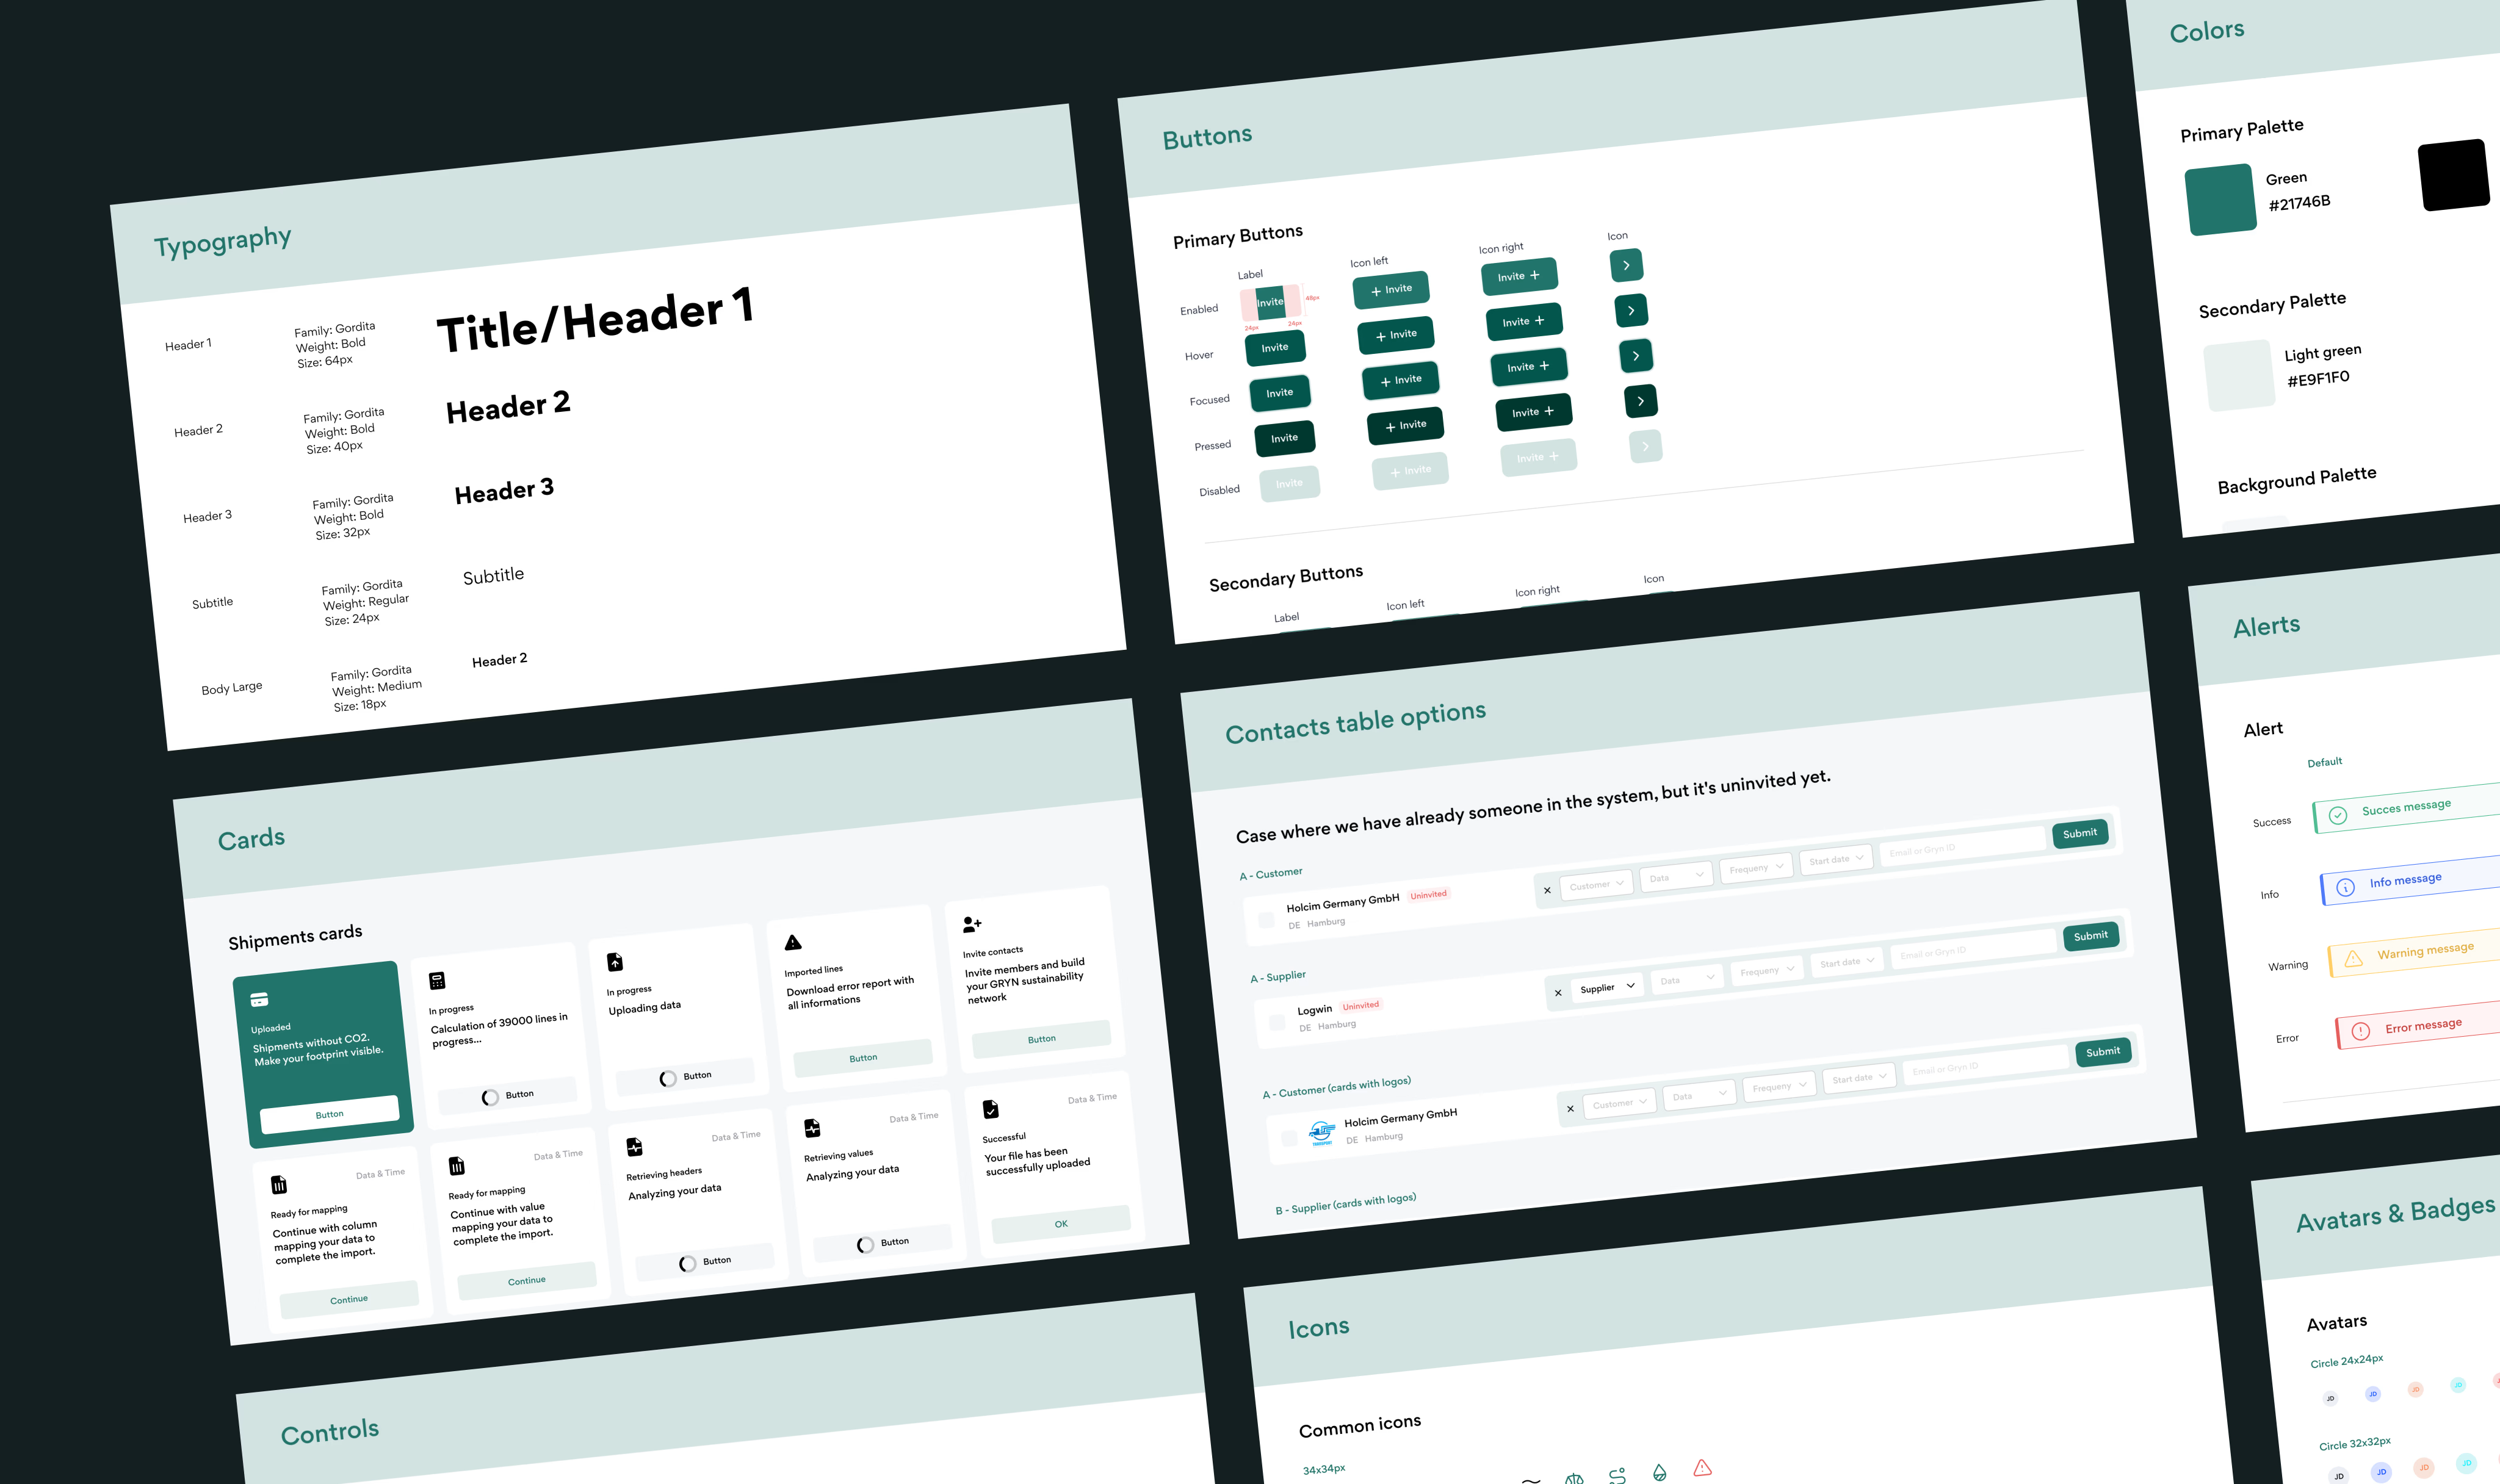
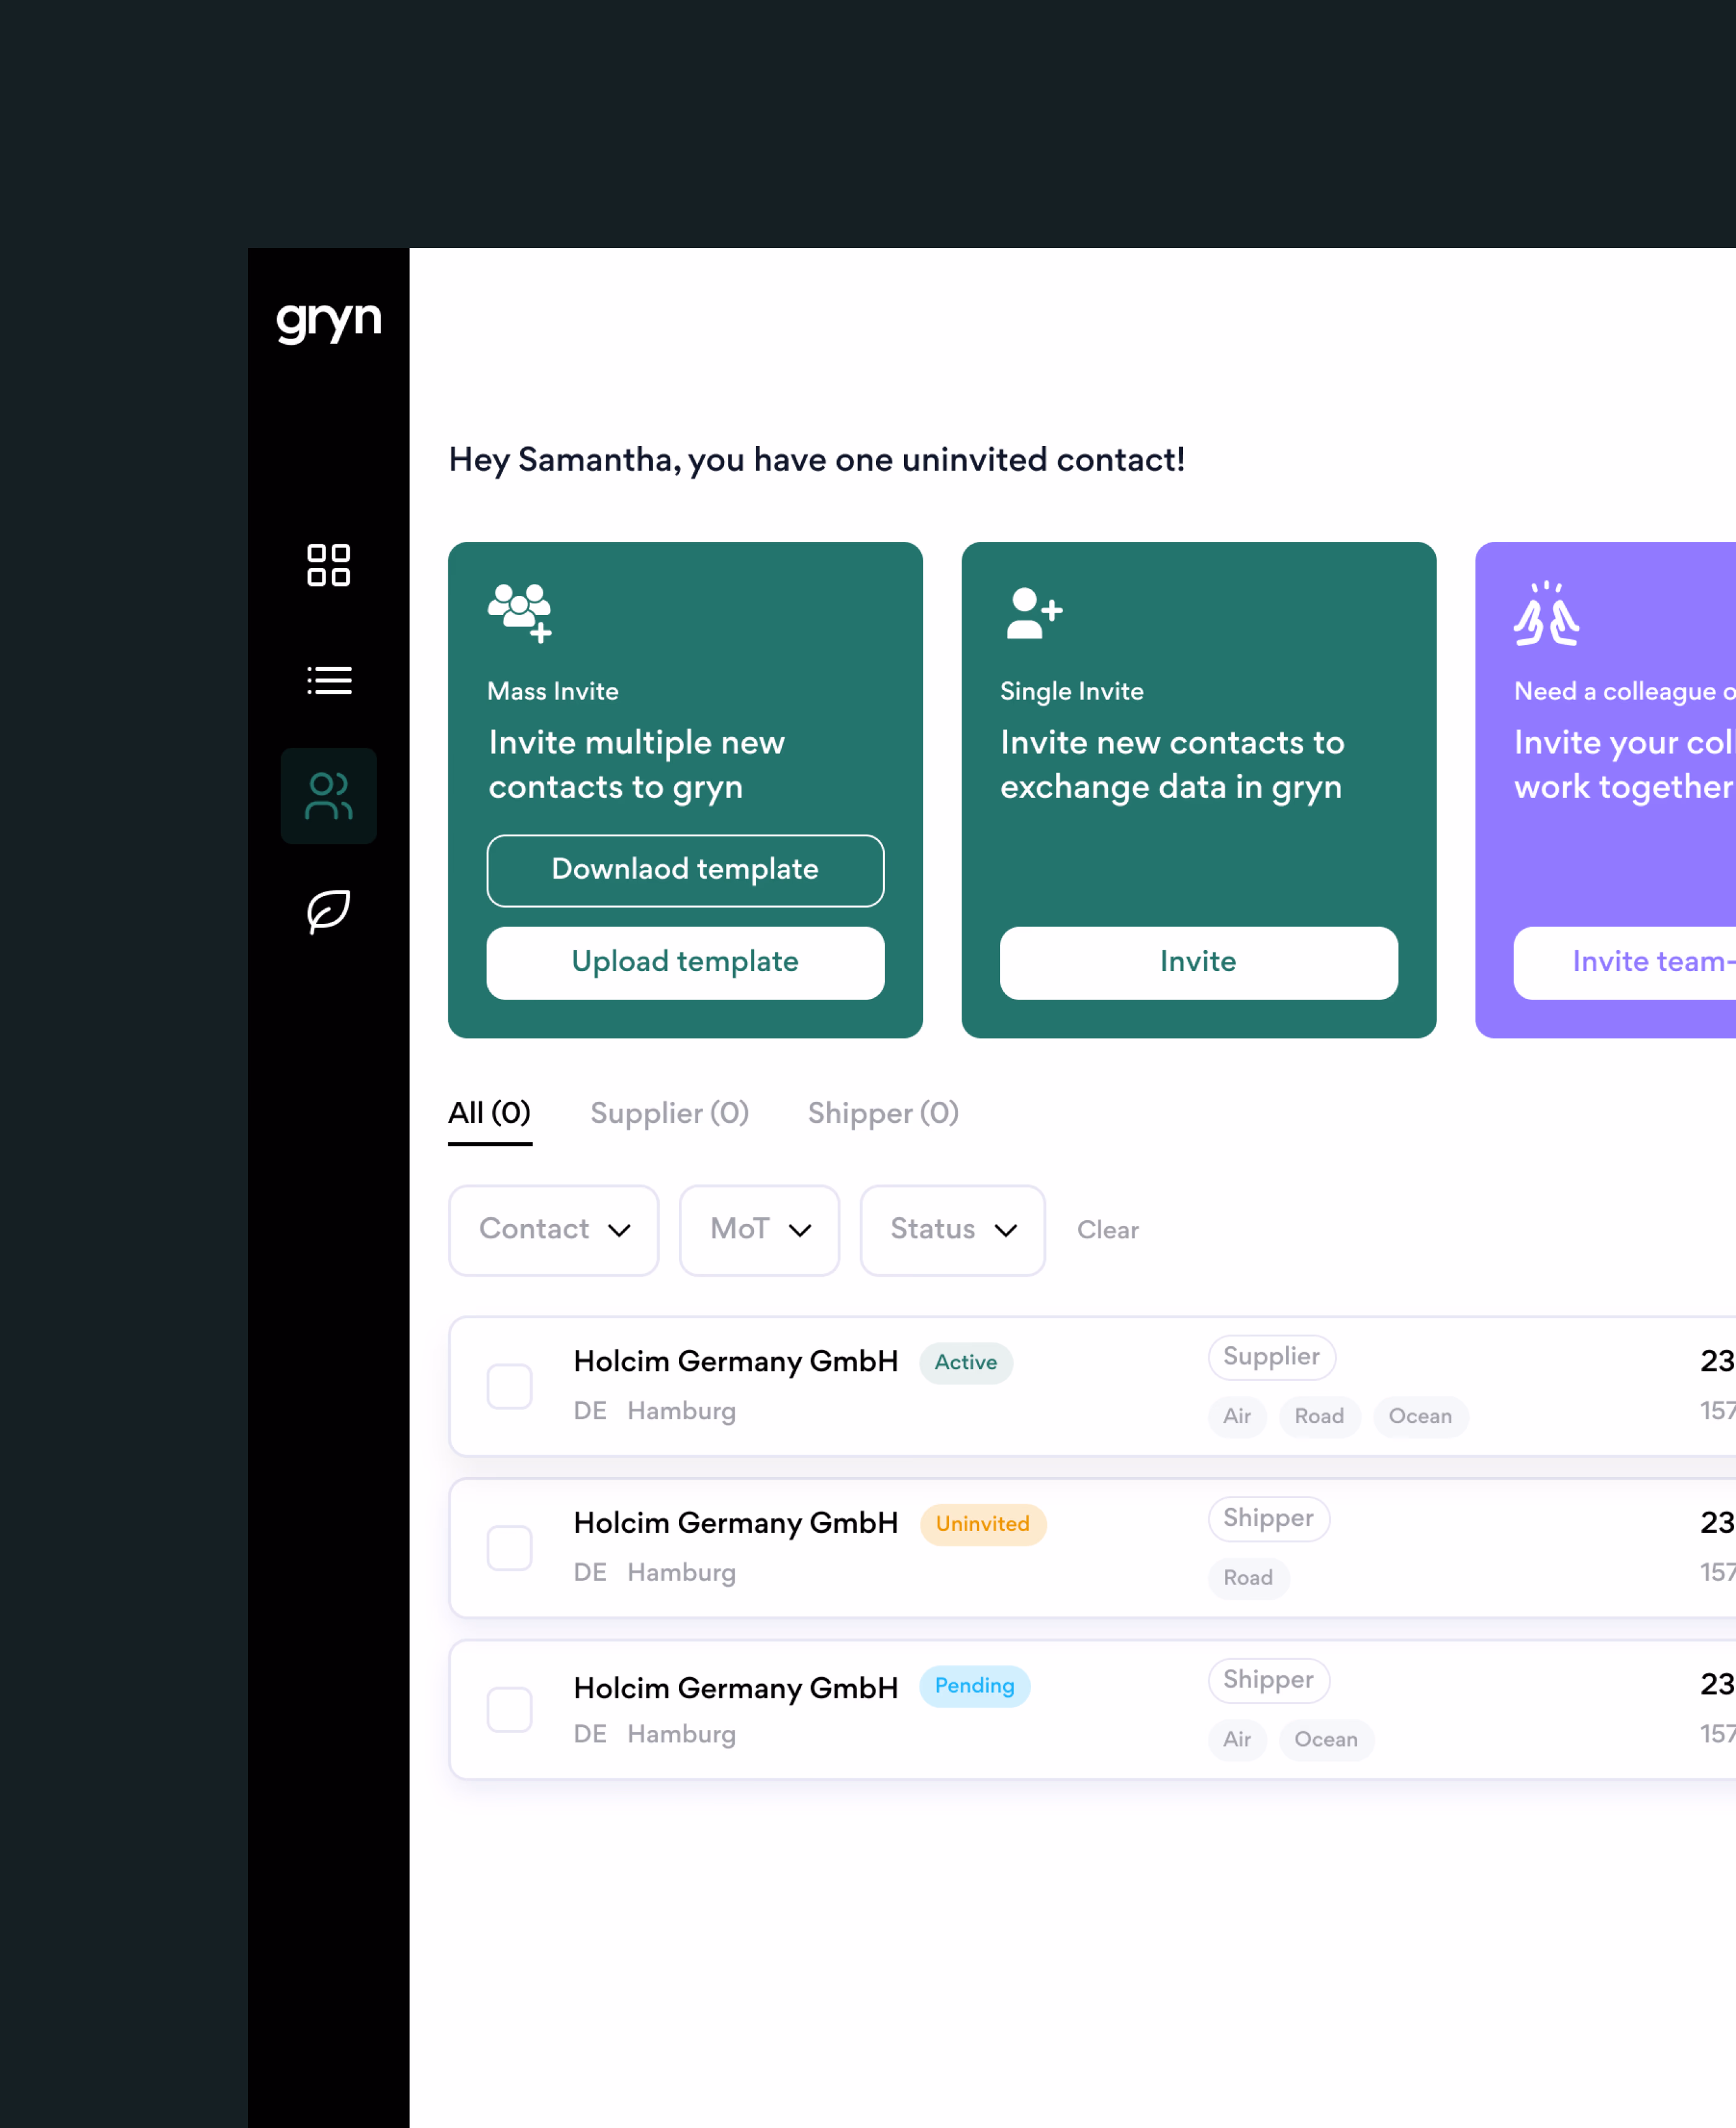
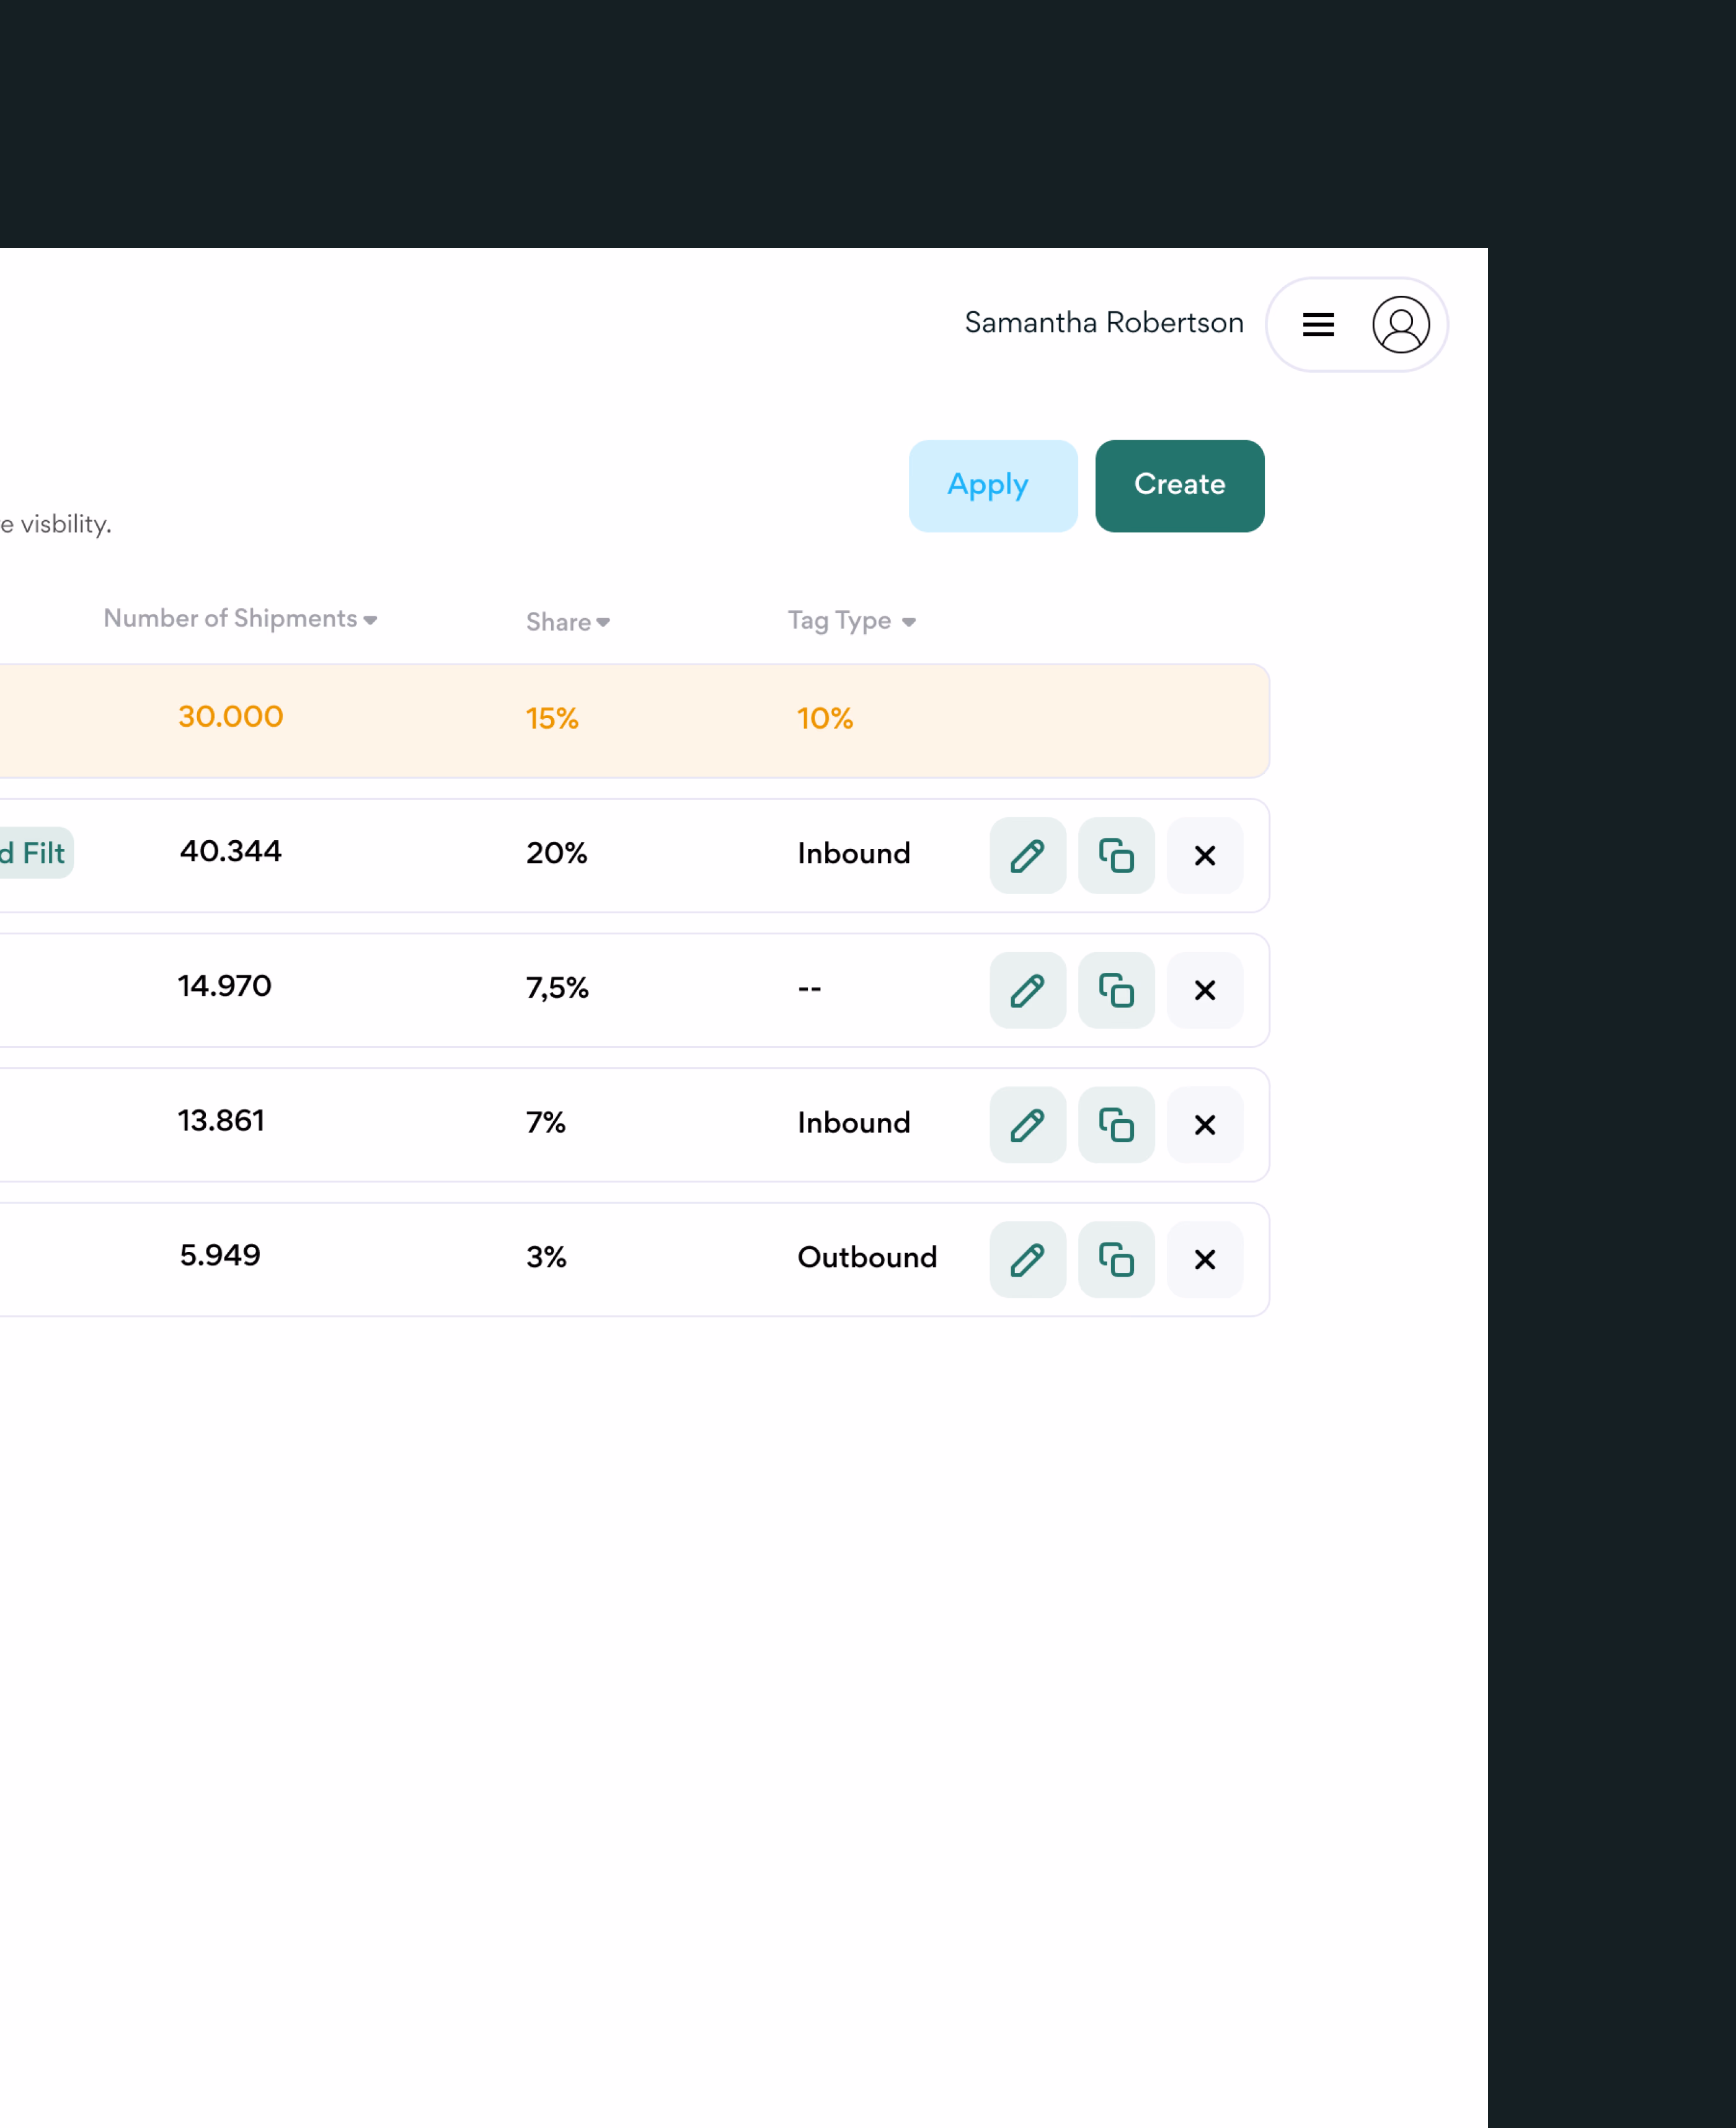
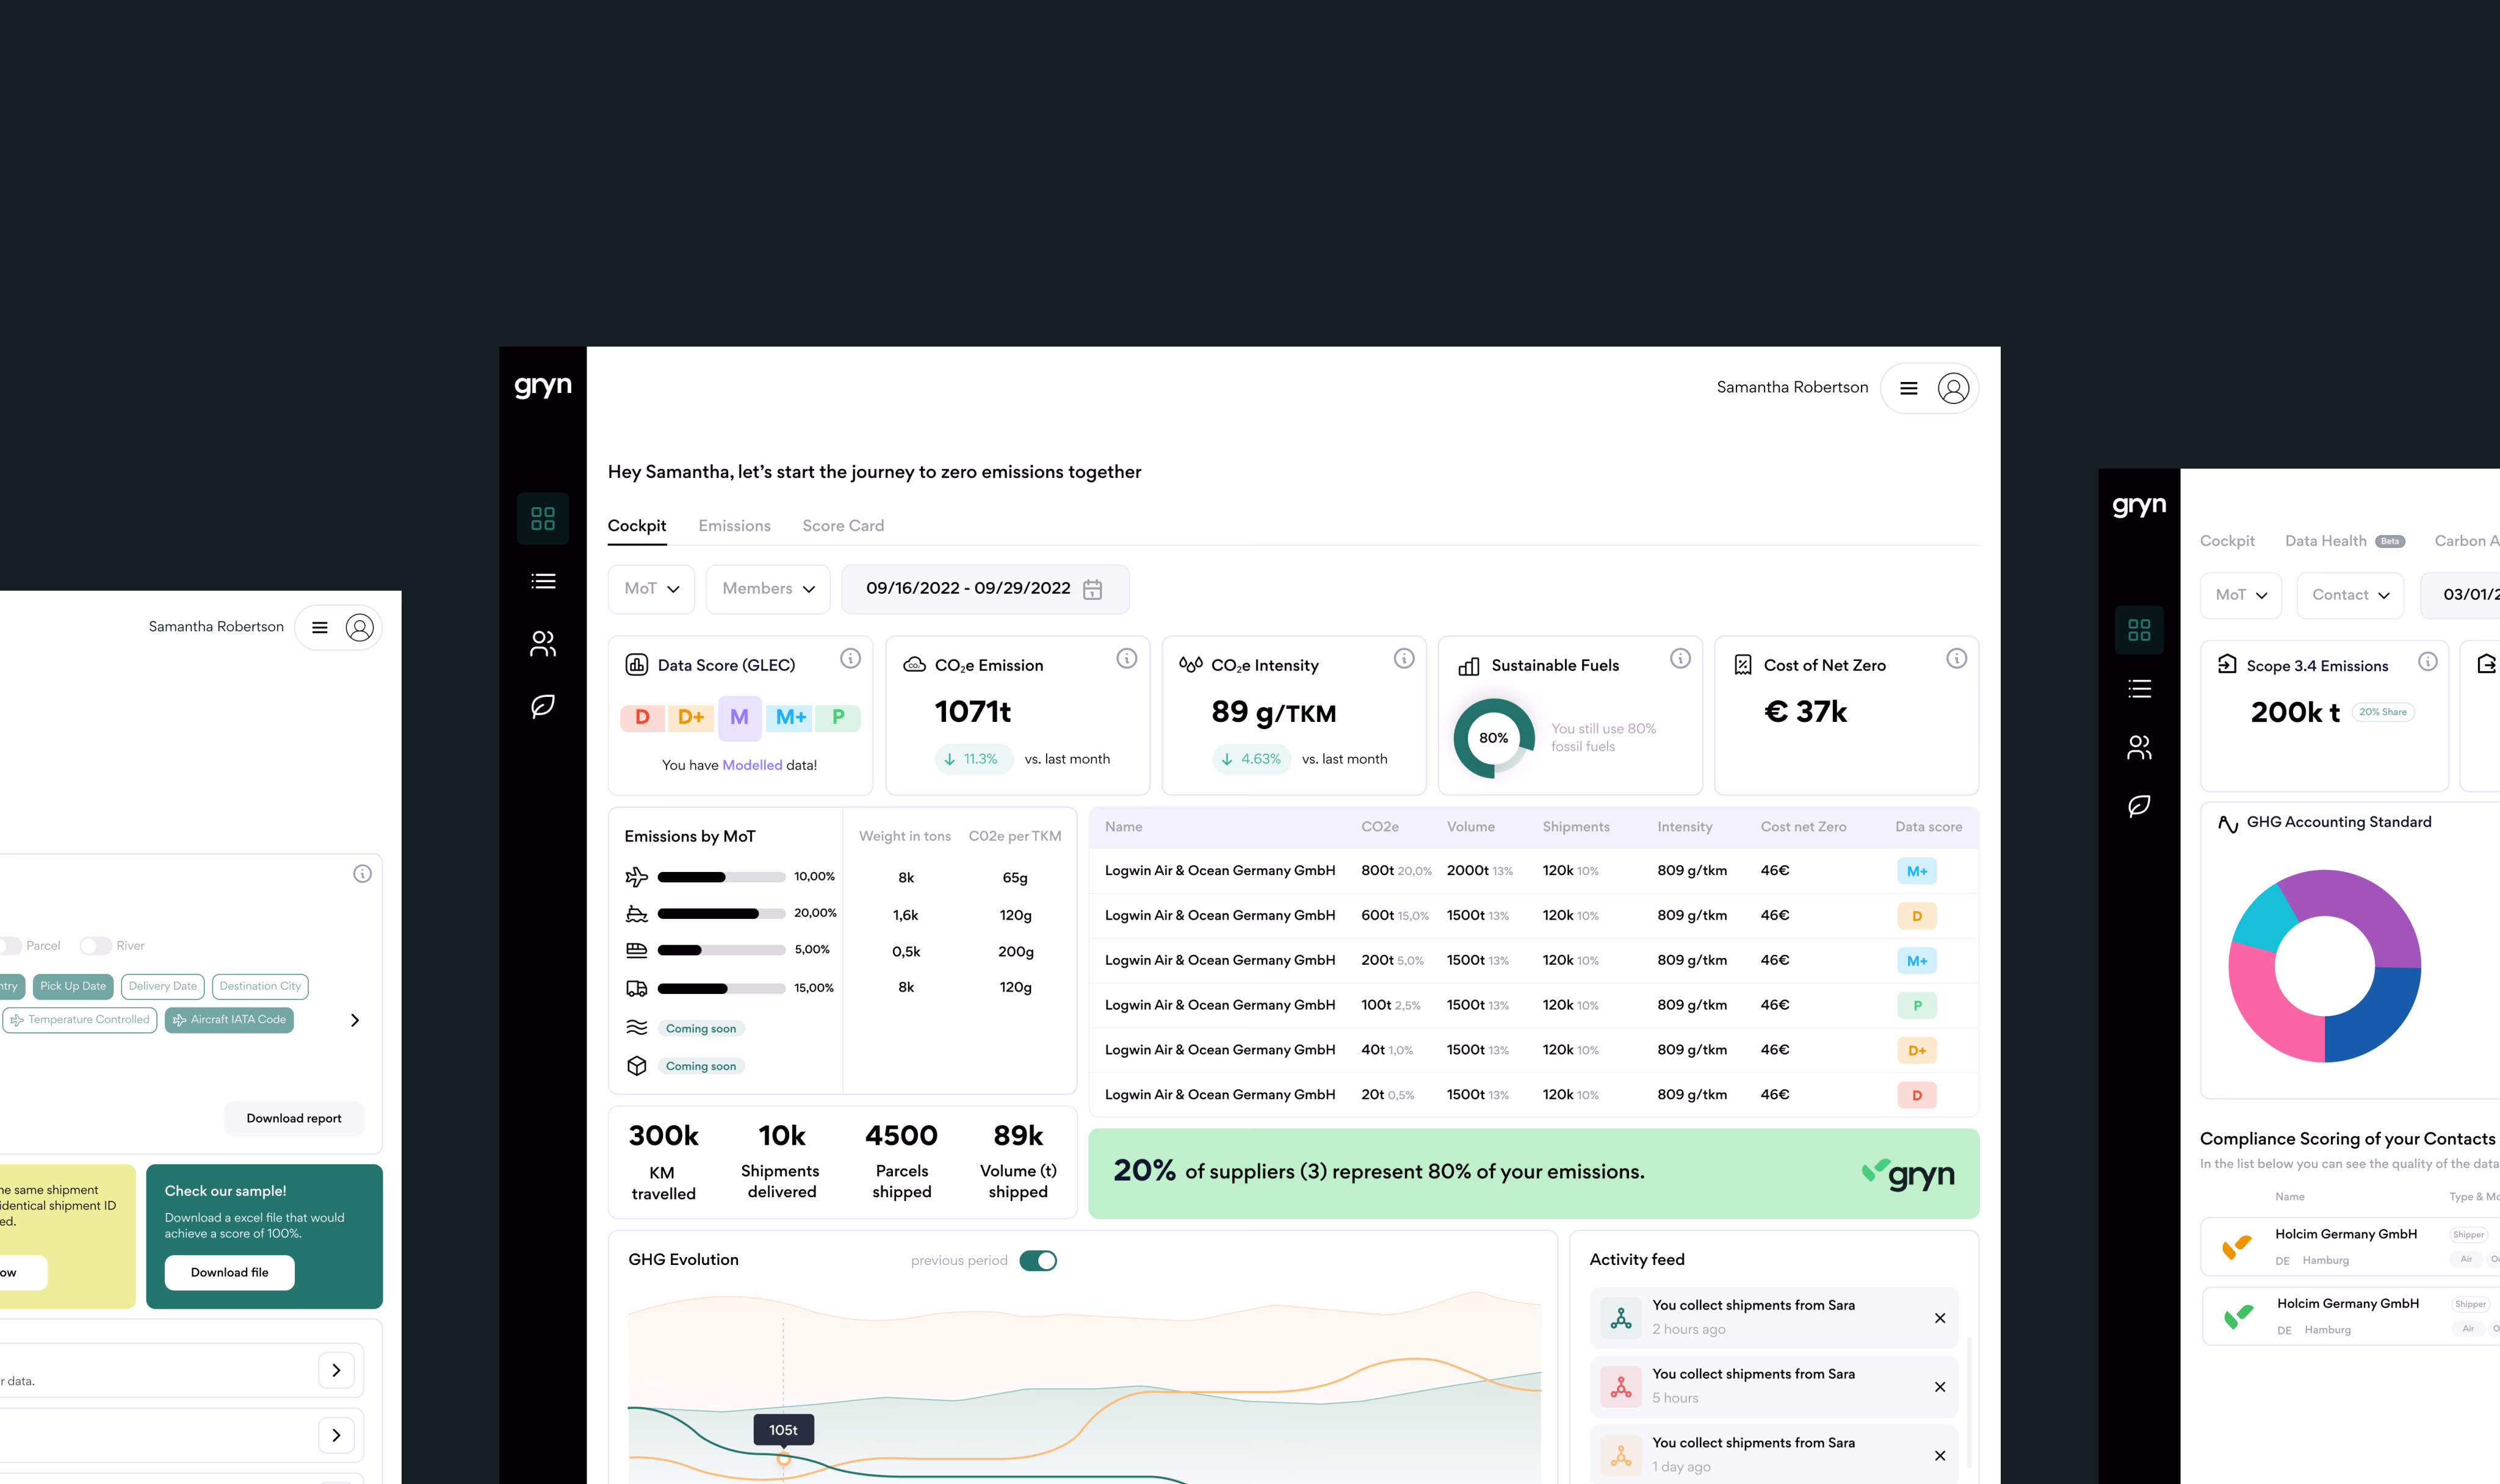
GRYN – Scope 3 Carbon Visibility Platform

UI/UX Design
Web Design

The right partner for your journey to zero emisssions

Client

Industry

SaaS, Environmental Sustainability

Location

HAMBURG, GERMANY

Services

UI/UX Design, Web Design

About the project

UI/UX Design
UX UI

GRYN is a SaaS platform that helps companies track and manage their Scope 3 carbon emissions. From a UI/UX perspective, the challenge was to design a platform that could make complex environmental data intuitive, accessible, and actionable. The product needed to balance regulatory compliance, data-heavy dashboards, and user-friendly navigation, catering to users from sustainability managers to logistics coordinators.

Visit Website

Process

Mapped out the platform structure, defining user flows and prioritizing core actions like emissions tracking, reporting, and compliance monitoring. Worked closely with developers and data analysts to ensure visualizations were accurate and technically feasible, without compromising UX.

Problem

  • Users struggled with complex interfaces that made carbon tracking tedious and error-prone.
  • Data visualization was inconsistent, and it was hard for users to interpret emissions metrics quickly.
  • Mobile and tablet usage were poorly supported, creating friction for on-the-go access.

Solution

  • Designed a clean, data-driven dashboard highlighting key metrics at a glance.
  • Developed interactive charts and visualizations to make complex emissions data understandable.
  • Implemented a responsive, mobile-first design, ensuring seamless access across devices.

Results

The design led to very good usability and stronger engagement. Users completed key tasks faster, interacted more frequently with the platform, and reported higher satisfaction with the overall experience.

30%

Users spent 30% more time interacting with the dashboards thanks to clearer visualizations and intuitive workflows.

+40%

Key actions like emissions reporting were completed 40% faster, reducing cognitive load and errors.

25%

Mobile and tablet usage increased by 25%, reflecting the success of responsive design.

X2

Net Promoter Score (NPS) improved significantly, as users reported better understanding and control over their sustainability metrics.

VU Avatar

Let’s Talk

I take on a limited number of new partnerships. Reaching out early helps us plan for the best results.

Custom designs tailored to your brand and goals

Designs that work as hard as your business

Focused partnerships for meaningful impact

Client parteners
Client parteners
Client parteners
Client Avatar
Client parteners
Client parteners
Client parteners
Client parteners
Client parteners
Client parteners
Client Avatar
Client parteners
Client parteners
Client parteners